Maps of NYPD Stops, 2011
Lee Hachadoorian on Dec 2nd 2013

The Bronx is heavily Black and Latino, and shows a high number of NYPD stops over much of the borough.
There have been a lot of ups and downs in the battle over the NYPD Stop and Frisk program. Over the Summer, a federal judge ruled the program unconstitutional as practiced, and appointed a federal monitor to oversee reforms. Then, a month ago, a federal appeals panel removed Judge Scheindlin from the case, and put a stay on her orders. Bill de Blasio was elected mayor promising to drop the City’s appeal, but lame duck Mayor Bloomberg tried to push the appeal to a full overturning of Judge Scheindlin’s ruling before leaving office. Now the full Second Circuit has put on hold any further action while the litigants negotiate—clearly taking the ball from Bloomberg and passing it to the mayor-elect.
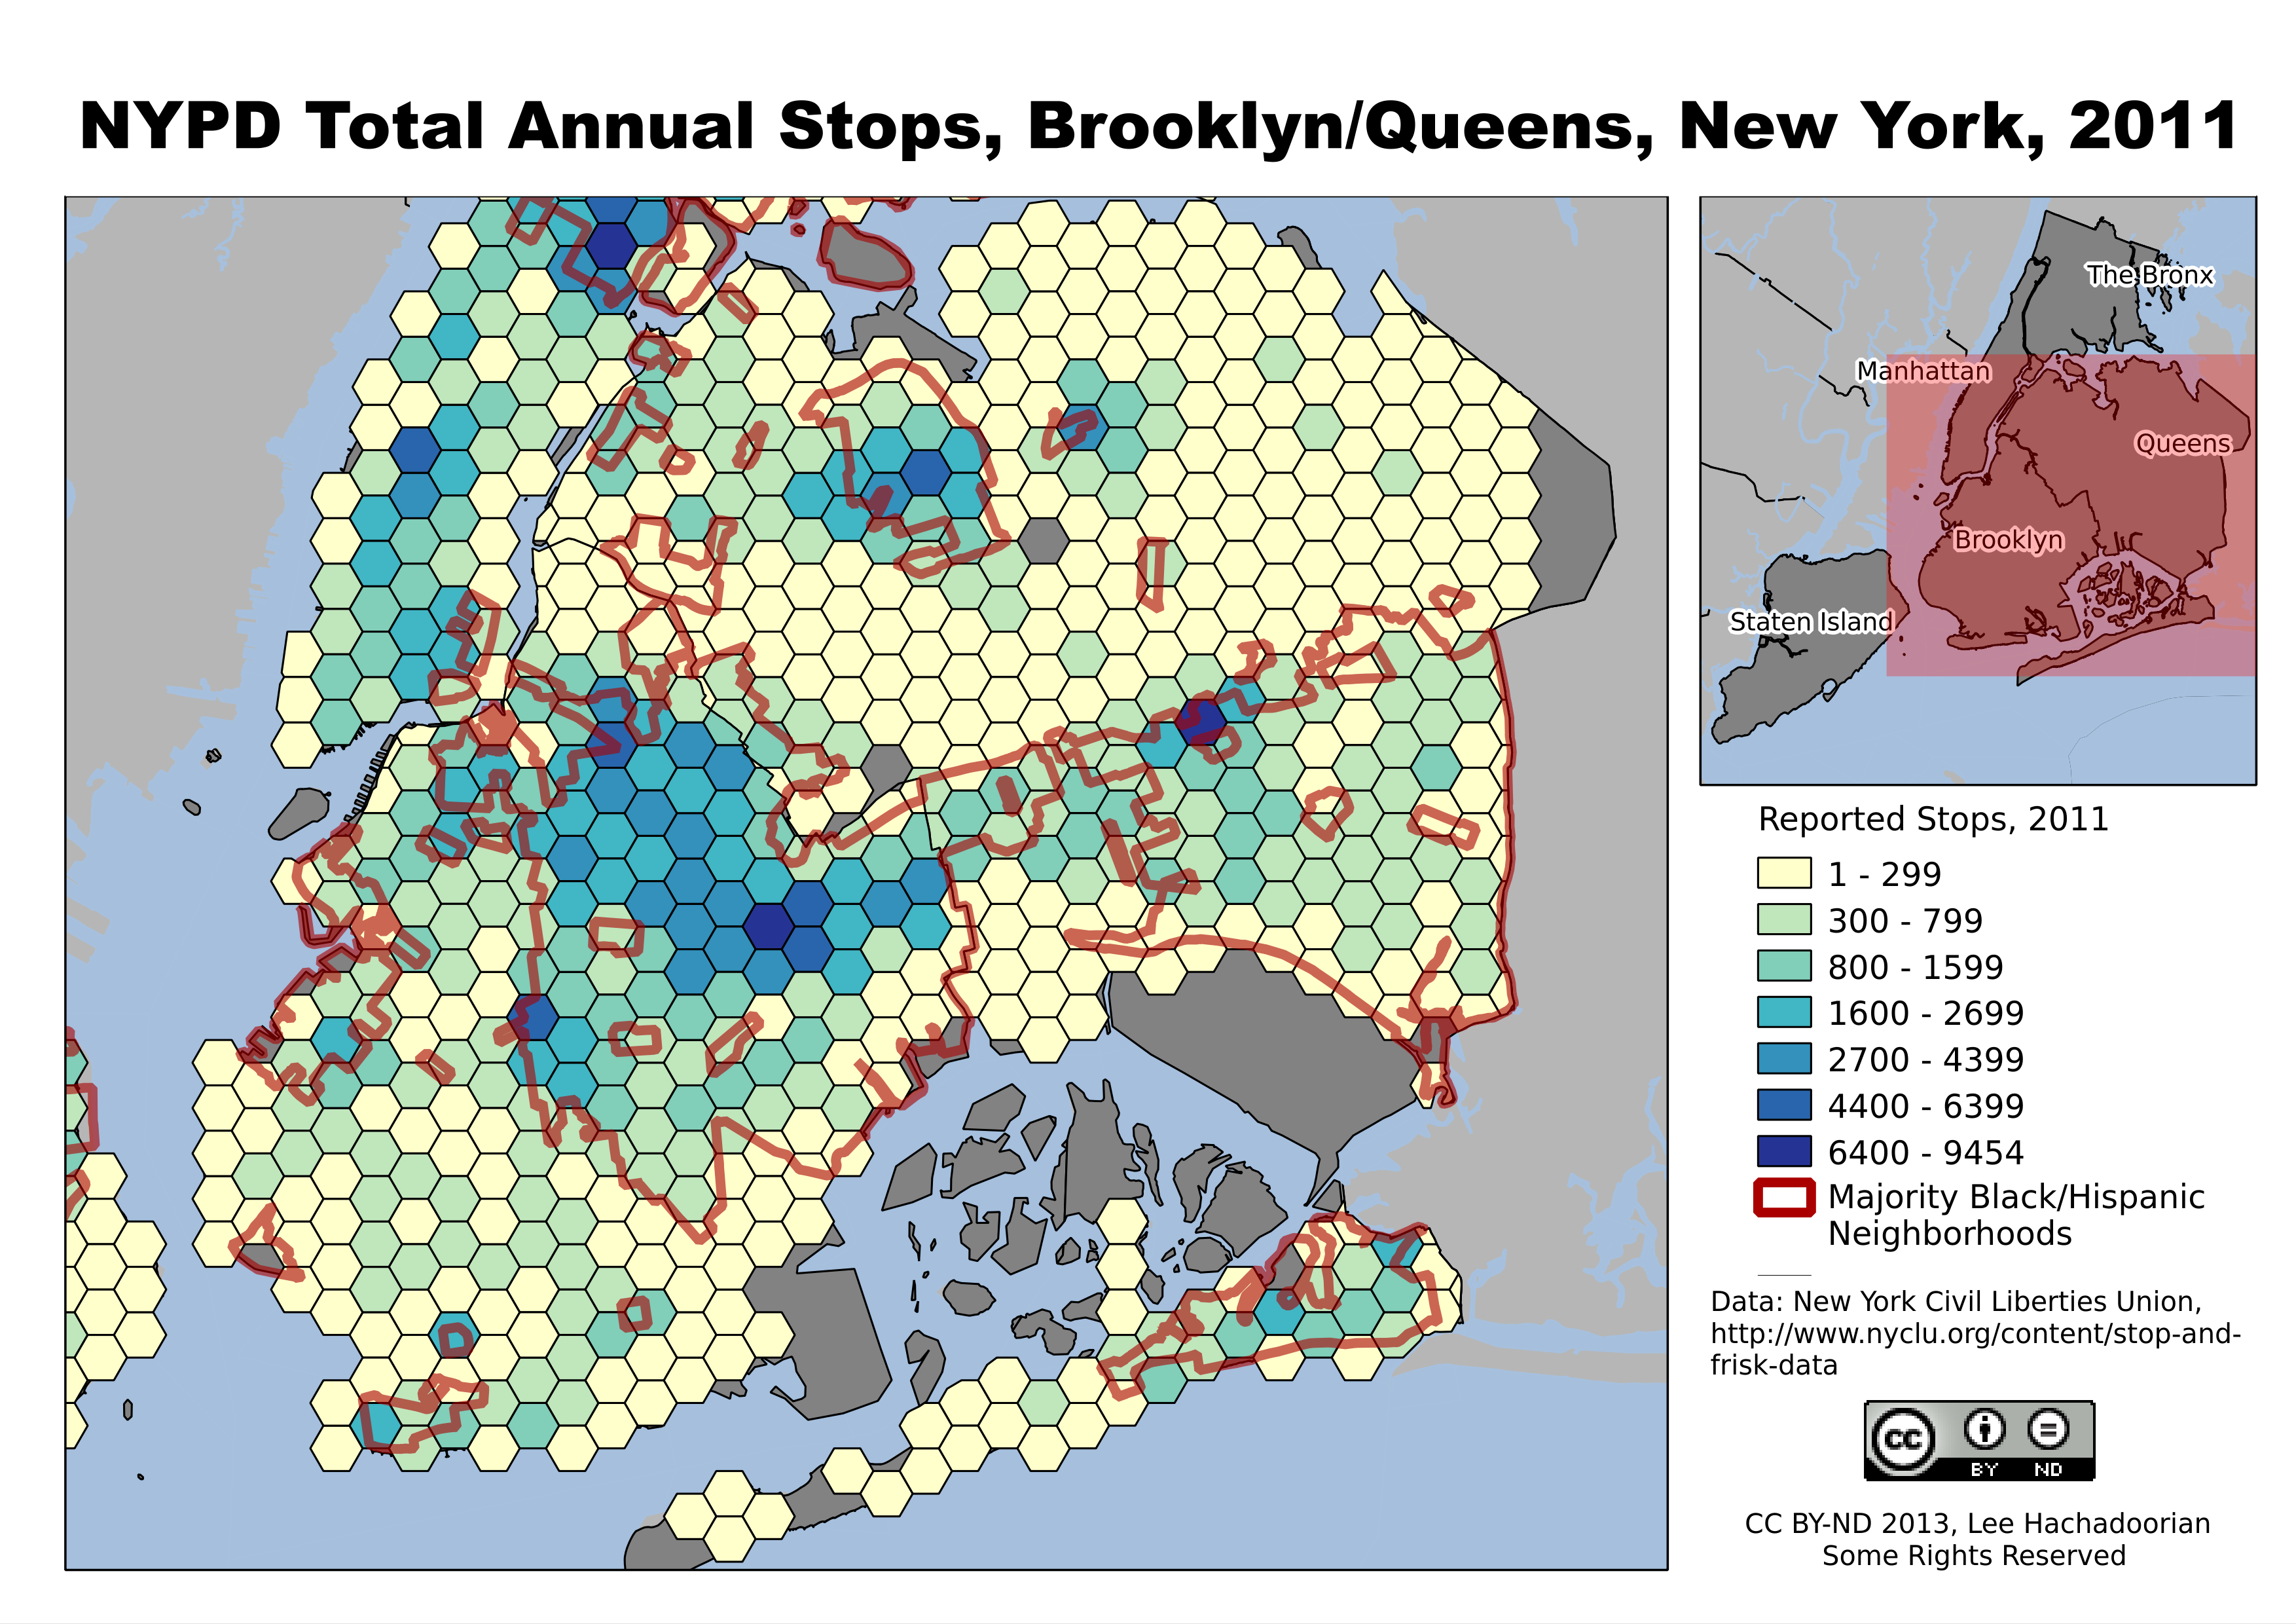
Stops are concentrated in predominantly Black and Latino neighborhoods like Bedford-Stuyvesant and East New York in Brooklyn, and East Elmhurst and Jamaica in Queens.
Much of the focus in the case has been on whether the Stop and Frisk program was implemented in a racially biased manner, with considerable concern over the targeting of young Blacks and Latinos. The maps I’ve created, based on the 2011 statistics, do show many more stops taking place in predominantly Black and Latino neighborhoods. The maps do not show the race of the people being stopped, an important consideration in the trial, as plaintiffs presented evidence that the “hit rate”—stops that actually led to the discovery of a crime—was much lower for Black and Latinos than for Whites, indicating that the police were using a different, and looser, standard for what they regarded as suspicious behavior by Blacks and Latinos.
The main exception to the correlation between neighborhood demographics and volume of police stops is in Manhattan. We do see a concentration of stops in the Black and Latino neighborhoods of Harlem and Washington Heights, but we also see generally higher stops in Manhattan than in the outer boroughs. Doubtless this is due to Manhattan’s generally higher nonresidential population (commuters, shoppers, etc.), as well as the generally higher pedestrian counts in Lower Manhattan and Midtown.
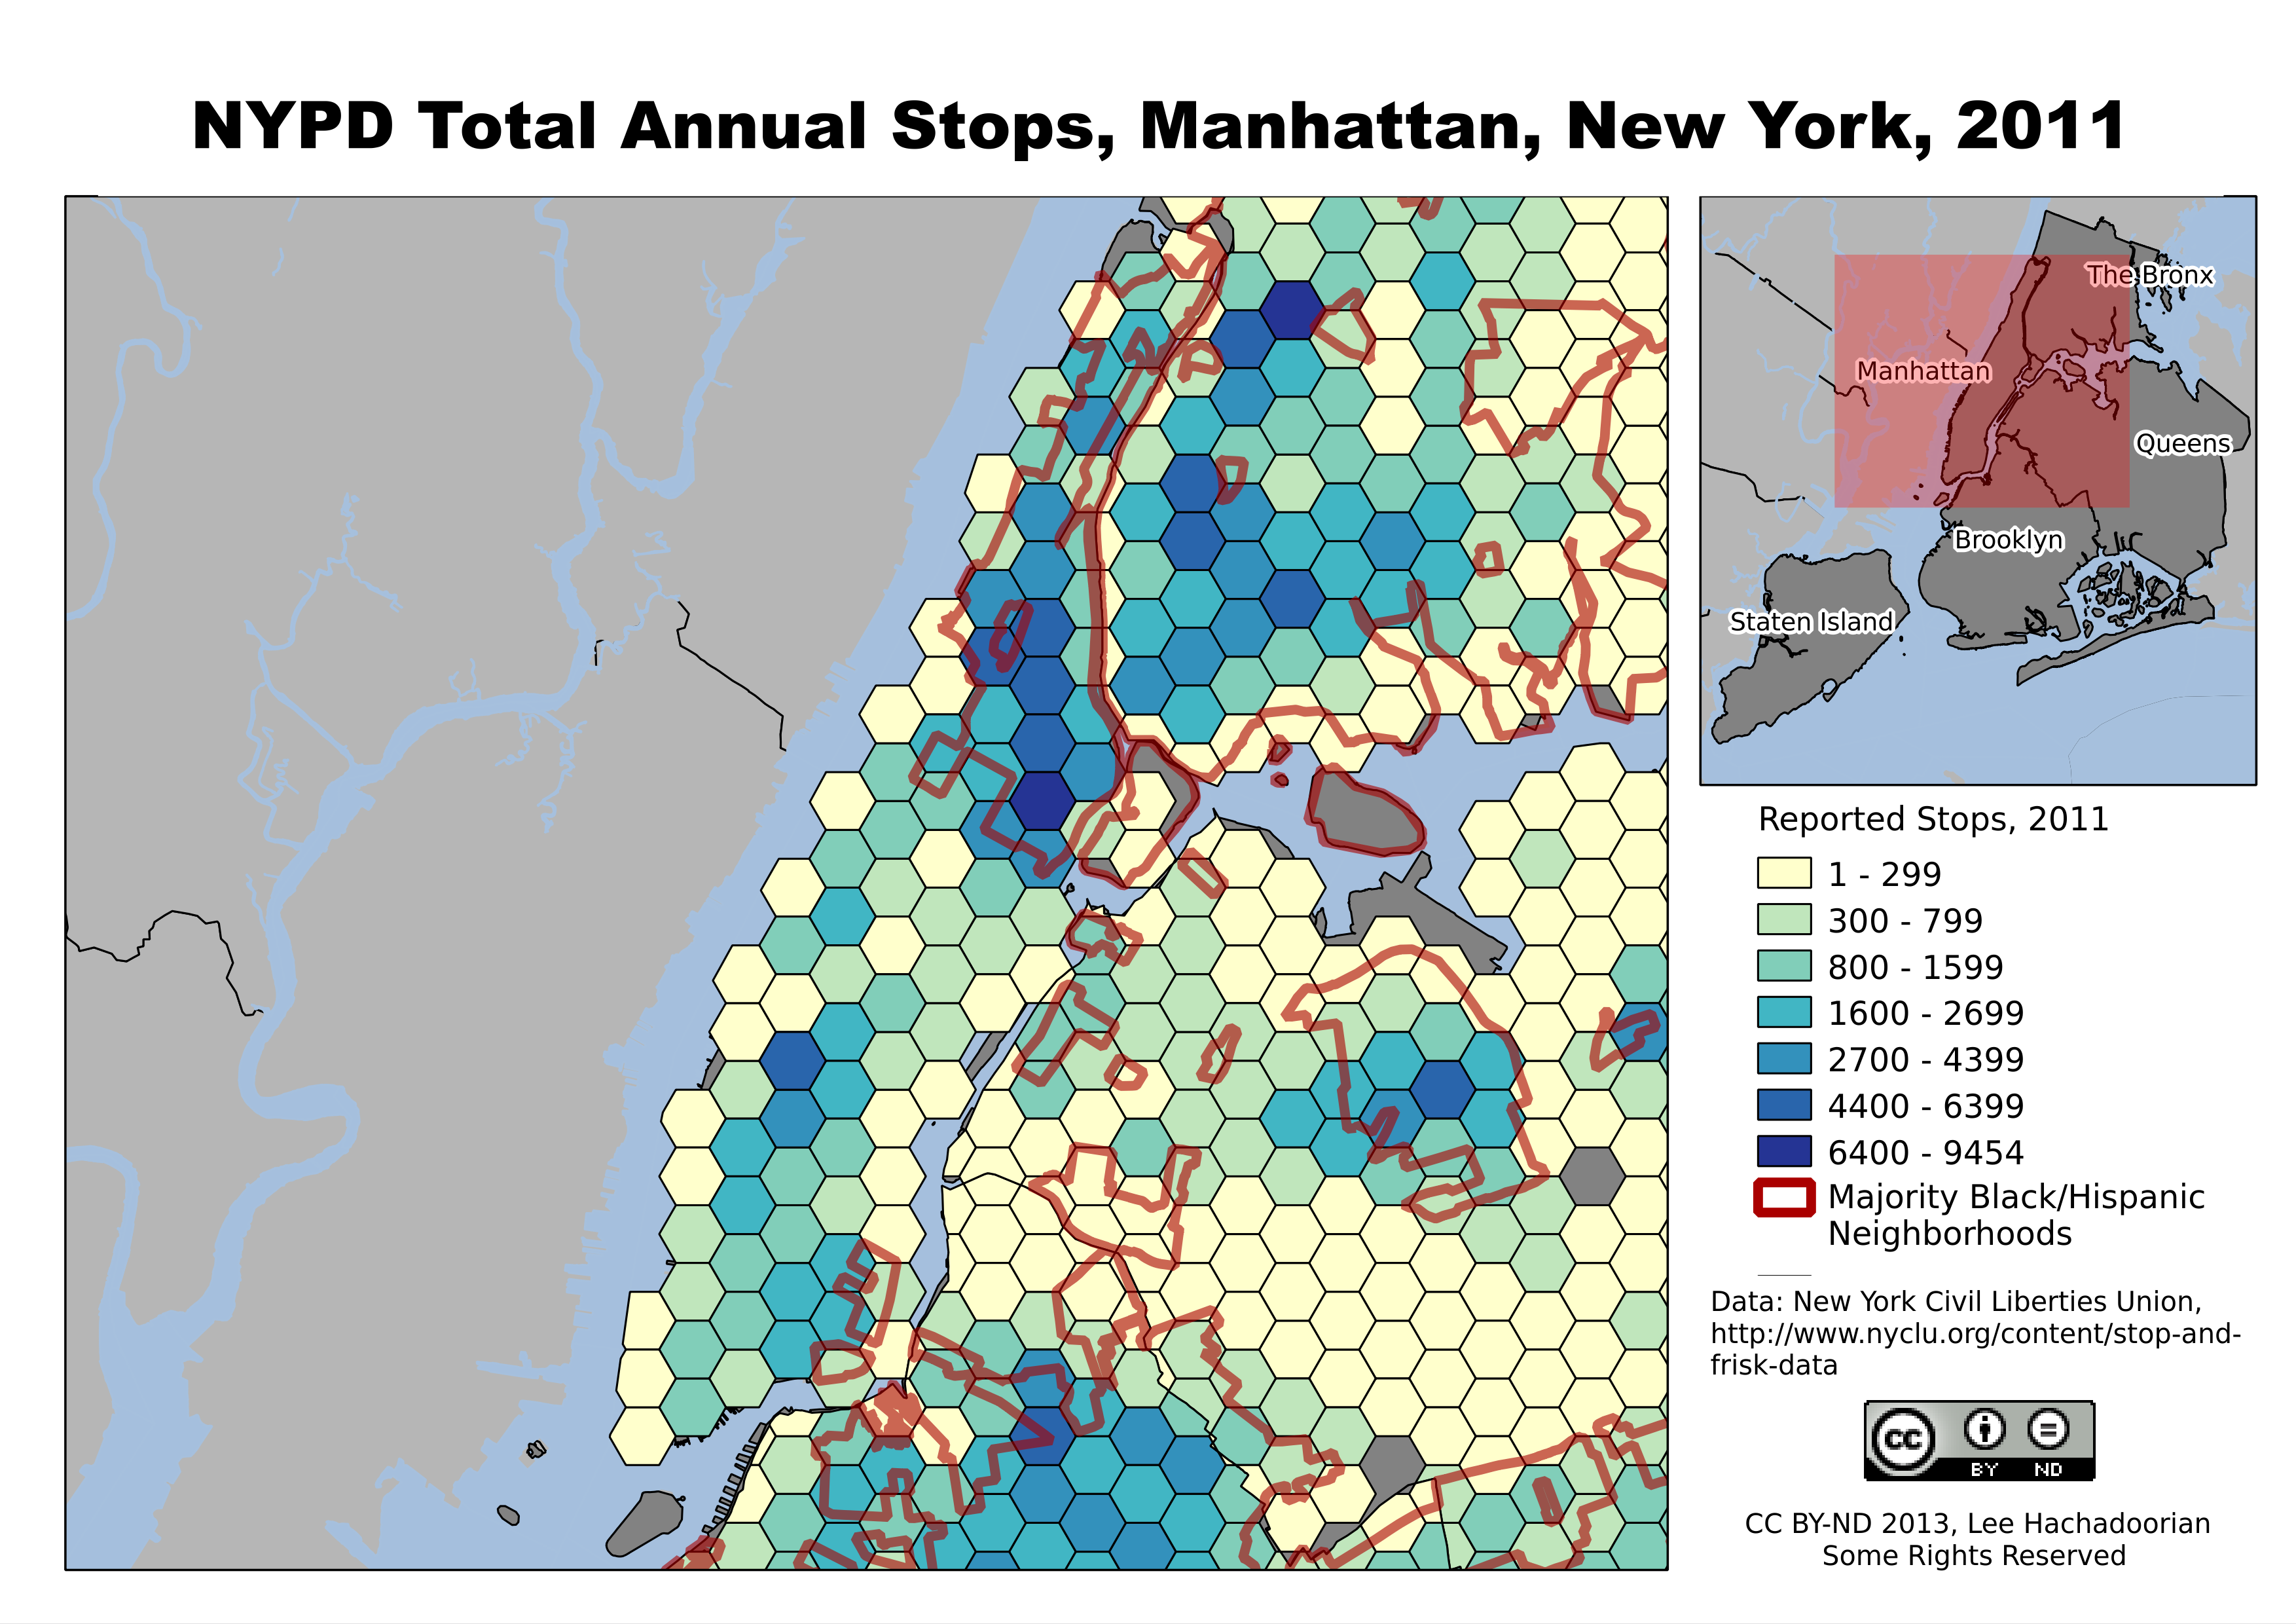
Manhattan, with its high daily influx of nonresidents for employment, shopping, and commercial activities, has high numbers of NYPD stops throughout the borough.
While the differences in “hit rate” helped Judge Scheindlin conclude that this policy led to “indirect racial profiling”, the ridiculously low yield—less than 12% of stops led to a summons or arrest in 2011 (about equally split)—suggests that the police are extremely poor judges of suspicious behavior. But what do you expect of a policy that allows the police to stop someone for “inappropriate attire for season” (about 7.5% of stops in 2011)?
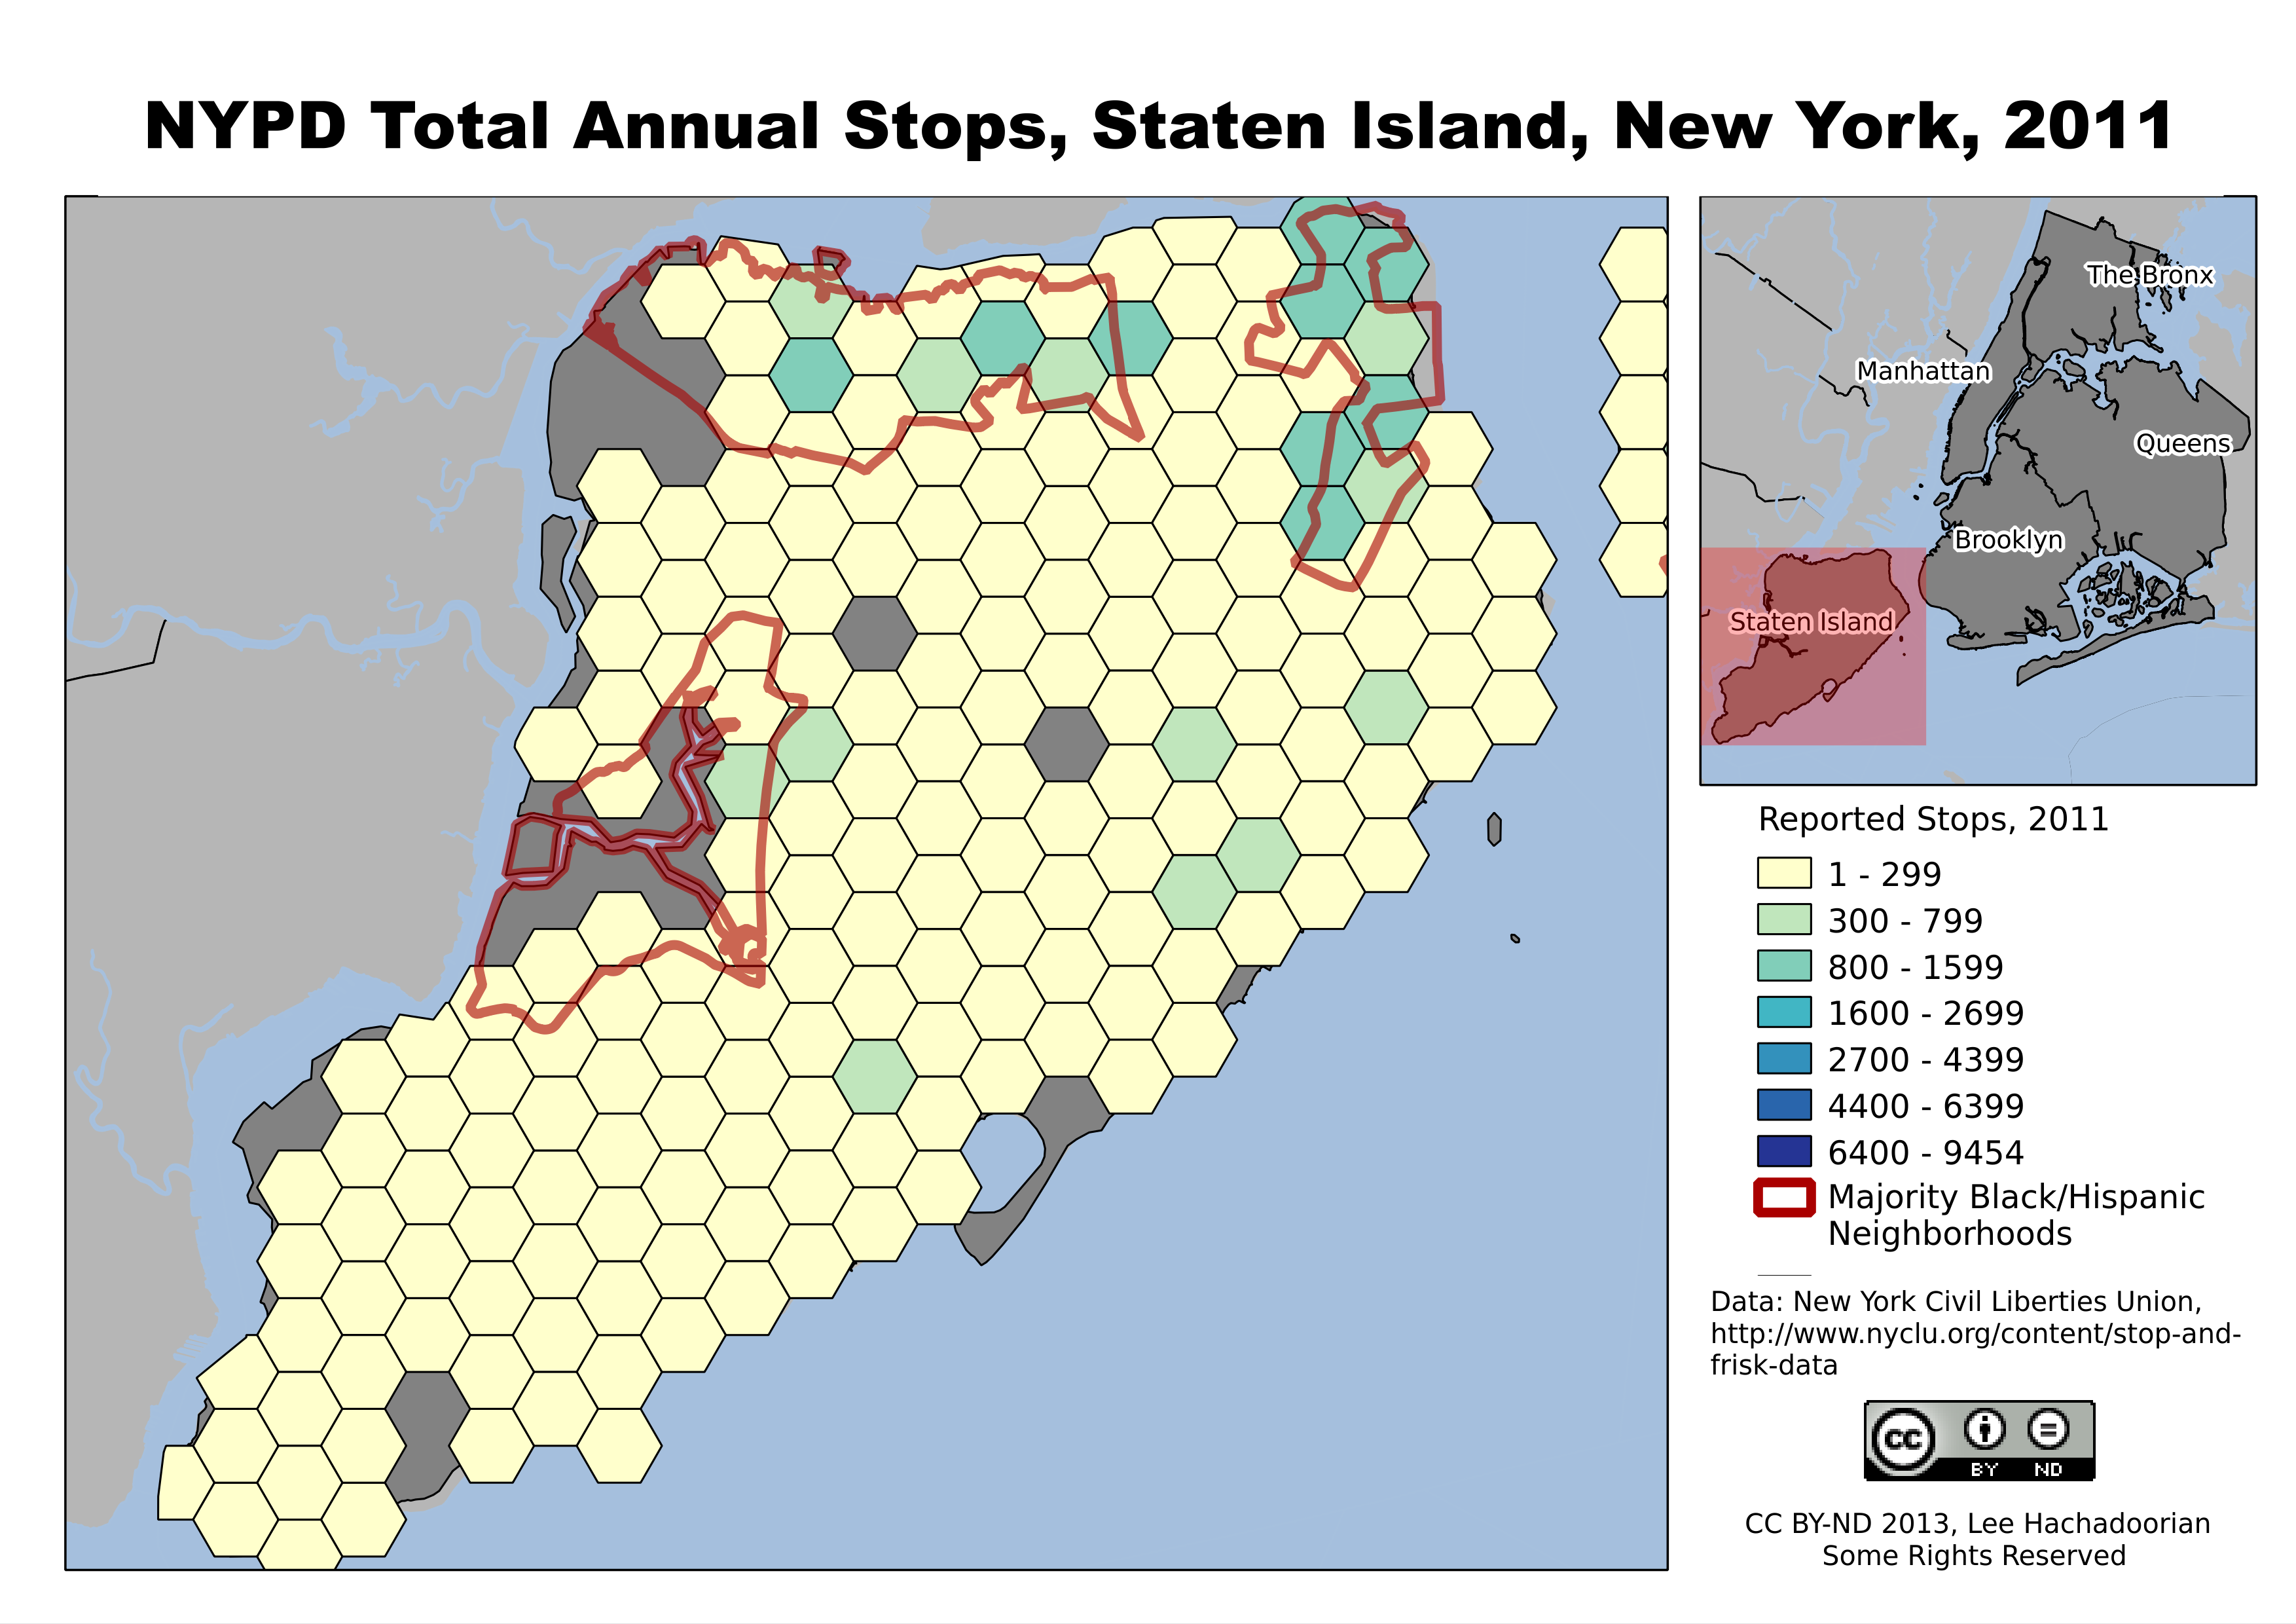
Staten Island’s population is more White, and subject to fewer police stops.
Filed in GIS,Governance | One response so far
Recent Victories for Open Geospatial Data
Lee Hachadoorian on Aug 28th 2013
The tagline of this blog is “Urban Economic Geography and Open Everything”. Free City supports free and open source software, open access publishing, and open data. Many governments are making much of their data publicly available, including New York City’s own open data portal. But geospatial data has sometimes been handled differently, sometimes because of privacy concerns, often because of security concerns. For example, the New York State GIS Clearinghouse allows direct downloading of orthoimagery (aerial photography) for much of the state, but for sensitive areas, including all of New York City, there is are some hoops to jump through.
Doubtless some of the evocation of privacy and security concerns is disingenuous, as much of the protected data is nonetheless commercially available. But in some cases it is the government itself which is licensing the data, raising the question of why they are only willing to give it to people who pay for it. In two recent cases having to do with property records, local governments chose or were forced to make their geographic data freely available. New York City’s Department of City Planning recently chose to make its MapPLUTO database available for download, whereas previously they had charged $300 per borough for this collection of building and tax records joined to parcel footprints. On the other side of the country, Orange County, California was forced by a court decision to open up their parcel database, which they had previously been licensing for $375,000!
In the Orange County case, the county was forced to release the data under the existing Public Records Act. Why wasn’t it already available? Because it was GIS data! The county claimed that the data was exempt because it was “software”. The California Supreme Court sensibly rejected that claim. After all, if the same information had been requested in hard copy, the county would have been legally required to provide it (and would have realized as much). I would go even further and ask, why is there an exemption for software? As a free software advocate, I would argue that the same reasons that apply to public records also apply to publicly developed software, including that it is paid for with tax dollars, and that there is a public benefit to its wide availability. There could still, as is the case with public records, be security exceptions for certain kinds of software.
The lawsuit which led to this case was filed by the Sierra Club, which had requested the parcel data for use in conservation planning. As a nonprofit, they could not afford the $375,000 licensing fee. Now that the court has ruled that the data are not exempt from the existing law, the Sierra Club will be able to obtain the data “for the cost of producing the physical copy”, presumably the cost of some DVDs, or free if provided electronically. In the New York case, the fees weren’t nearly so egregious, but nonetheless, I knew of small nonprofits, and—until the Grad Center licensed the data—CUNY grad students who could not afford to pay them.
The size of the fees—a lot for a grad student, not a lot for a government the size of New York City’s—really call into question why they existed in the first place. At $375,000 a pop, Orange County claimed that the fees helped support the GIS services that made the data available in the first place. But NYC’s Department of City Planning was only collecting $50 to $80 thousand a year from their licensing scheme, which is pretty small potatoes. Furthermore, at least one nonprofit obtained the data for free through a NYS Freedom of Information Law Request! So DCP, unlike Orange County, did not even attempt to argue that the data were exempt from its state’s public records law. But they did require the nonprofit to sign the standard license agreement, which restricted redistribution of the data. This does seem to suggest that, rather than pecuniary interest, DCP was more interested in asserting control over the data for some reason or another, and that there was something about this data in particular that it was concerned about, since it provided virtually all of its other data for free via public download.
Thanks are due to Steve Romalewski, my friend and former boss at Center for Urban Research. Steve has advocated for the freeing of this data set for some time, and in announcing the new DCP policy on his blog, he thanks several others in academia, journalism, and the nonprofit world for their contribution to this wonderful result.
Filed in GIS | Comments Off on Recent Victories for Open Geospatial Data
QGIS Fast SQL Layer
Lee Hachadoorian on May 7th 2012
PostGIS and SpatiaLite offer a large number of spatial query operations, including buffers, intersections, and spatial joins. It’s really useful, especially when you’re still experimenting, to visualize your results without having to create a new spatial table, spatial view, or exporting to a shapefile or other GIS data format. Fortunately, there are several ways to do this, including at least three plugins for Quantum GIS: Fast SQL Layer, PostGIS Query Editor, and RT SQL Layer. In this blog post I will walk you through using Fast SQL Layer. Continue Reading »
Filed in Computing,GIS | One response so far
New York State Celebrates the 200th Anniversary of the Gerrymander
Lee Hachadoorian on Mar 30th 2012
Colleagues at Center for Urban Research have posted a fun interactive map for visualizing the various New York State redistricting proposals. New York, like all states, is redrawing state and federal legislative districts based on the 2010 Census. So far, it’s not going so good. The proposals released by the legislature have been widely criticized for not preserving “communities of interest”, a common redistricting desideratum. The legislature was unable to agree on federal districts, and left that up to a federal court. State legislative districts were signed into law by Gov. Cuomo, in exchange for a legislative pledge to create a bipartisan redistricting panel for the next go round (i.e., 2020). But the redistricting reform that is shaping up has been criticized by a former New Yorker and current member of the California Citizens Redistricting Commission for, among other things, leaving final adoption in the hands of the legislature. Continue Reading »
Filed in GIS,Governance | Comments Off on New York State Celebrates the 200th Anniversary of the Gerrymander
Spatialite GUI
Lee Hachadoorian on Jan 31st 2012
Why SpatiaLite?
I spent this weekend getting the SpatiaLite GUI installed, with help from SpatiaLite Users Google Group. SpatiaLite is an open source source geodatabase built on top of SQLite, itself an open source database. As a lightweight, “server-less” database, SQLite is frequently used as an embedded database by other applications, including Firefox, Google Chrome, Skype, iTunes, Clementine (my preferred FOSS music player), and Dropbox (on the client side). Continue Reading »